Introduction
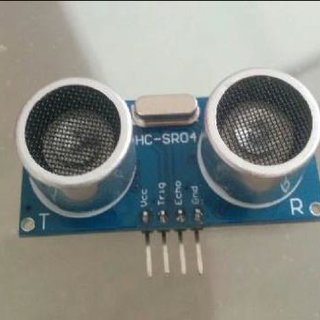
An ultrasonic or SONAR sensor is an electrical device that determines the distance between an object in front of it and itself by emitting small ultrasonic waves and using the time required for the waves to reflect off of the object and return to the sensor to determine the distance (Burnett, 2020). This method of determining the distance between the sensor and an object has proved to be very useful in regard to range-finding tasks over the years; however, there are a few flaws that are present within the sensor’s design (Gillespie, 2019). Because the speed of the sound waves is dependent on the medium by which they travel, along with the temperature of the environment, the accuracy of the ultrasonic sensor can vary depending on the environment where the sensor is collecting its measurements. Also, the ultrasonic waves that are emitted from the sensor have to be reflected off of a mostly flat, large surface; otherwise, the waves will not reflect back to the sensor correctly (Gillespie, 2019). According to several manufacturer datasheets, at normal room temperature (70°F) the maximum error that will occur in the HC-SR04 ultrasonic sensor’s measurements is approximately 3 mm (How HC-SR04 Ultrasonic Sensor Works & Interface It With Arduino, n.d.; Ultrasonic Distance Sensor (HC-SR04), n.d.). Throughout this paper, this error will be verified to determine if it is an accurate measurement by comparing it to a dataset of distance measurements that were collected from a personal HC-SR04 ultrasonic sensor through various statistical tests. There will also be a test to see if the accuracy of the sensor is affected by the distance between itself and the object that it is detecting.

Method
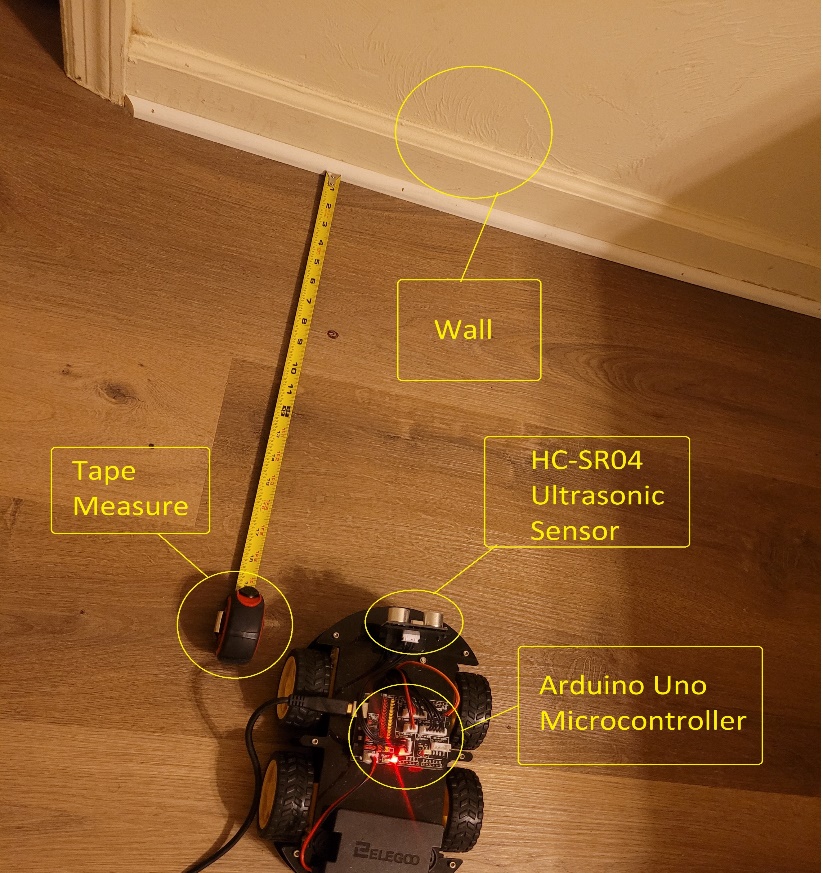
As stated previously, this study was conducted to verify the error measurement in HC-SR04 ultrasonic sensors that have been provided by several datasheets. In order to perform the experiment, a personal ultrasonic sensor was used to collect distance measurements. This sensor is connected to an Elegoo Smart Car V-3.0+ Robot because it was the only ultrasonic sensor that was accessible at the time. The experiment was designed such that the robot was placed at an arbitrary distance away from a wall and this distance was measured by a tape measure.[1] From there, the ultrasonic sensor that is attached to the robot will emit sonic waves to determine how far the wall is away from the robot, and that distance will be displayed through an Arduino serial monitor. An image of this experiment set-up will be displayed below:

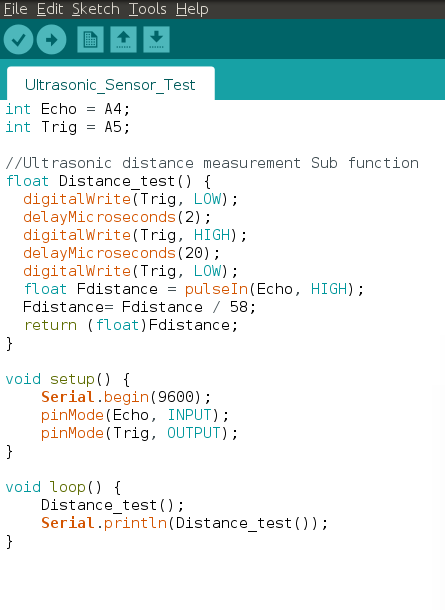
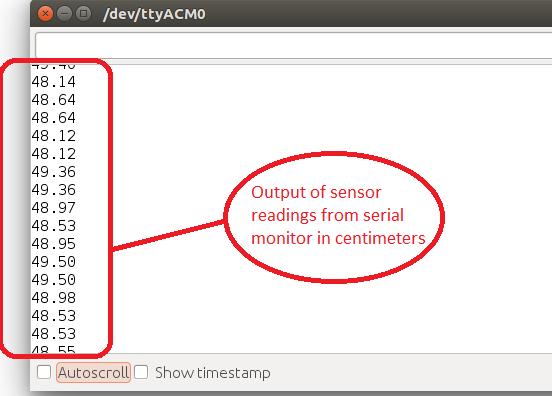
The data collected from the HC-SR04 ultrasonic sensor is sent to the Arduino Uno microcontroller and then transported to the serial monitor through a data cable. The serial monitor that displays the sensor’s distance measurements along with the Arduino sketch written for the ultrasonic sensor will be shown now:


For each distance measurement that was taken, 16 different distance readings from the serial monitor were randomly selected and averaged in order to find the optimal range reading that the sensor was outputting. The sampling method of using 16 different sensor readings to find an average sensor reading was employed in order to minimize the noise present in the sensor. While the experiment was being conducted, the temperature of the area was kept at approximately 70°F in order to keep the speed of the sound waves emitted from the sensor at about the same velocity as the sound waves that were being emitted from the HC-SR04 ultrasonic sensor in the datasheets. This was done by setting the thermostat to exactly 70°F; however, while this was the temperature that the thermostat was set to, it is possible that the exact temperature in the room was slightly different due to insulation issues in the area – thus causing a slightly different speed of sound than what the manufacturers calculated. Assuming that the temperature in the area was either approximately 69°F or 71°F, then the speed of sound would be either or – with the speed of sound at 70°F being (Speed of Sound Calculator, n.d.). Using a few calculations of true error, a combined margin of error that the speed of sounds at 69°F and 71°F produce when compared to the speed of sound at 70°F is approximately With the combined margin of error being less than a percent, we can assume that the data collected using our sensor is nearly accurate to the data that the manufacturers collected.
The breakdown of the results collected from this experimental process will begin with an analysis of the true error collected by the sensor’s distance measurements. This will be followed by an analysis of both the absolute error and absolute relative error of the distance measurements in order to compare the absolute error to the error stated by the HC-SR04 datasheets ~3 mm The rationale behind also including the true error of the distance readings instead of using only the absolute error of the readings was to determine if the sensor’s true error was significantly different from zero. Analyzing the true error in the distance readings allows one to determine if the distance readings measured by the HC-SR04 sensor is significantly different from the actual distances between the objects and the sensor. The results of the study will also contain a two-sample test to determine if the distance by which the sensor readings are taking place has an effect on the error of the readings. The two samples that will be tested will be the fifteen shortest and fifteen longest distance readings from the sensor data that was collected. These samples will be averaged and then a statistical test will be employed in order to determine if the errors between the two samples are significantly different from each other.
Result


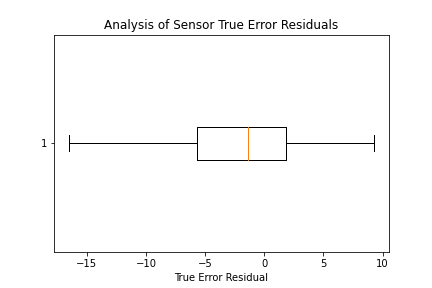
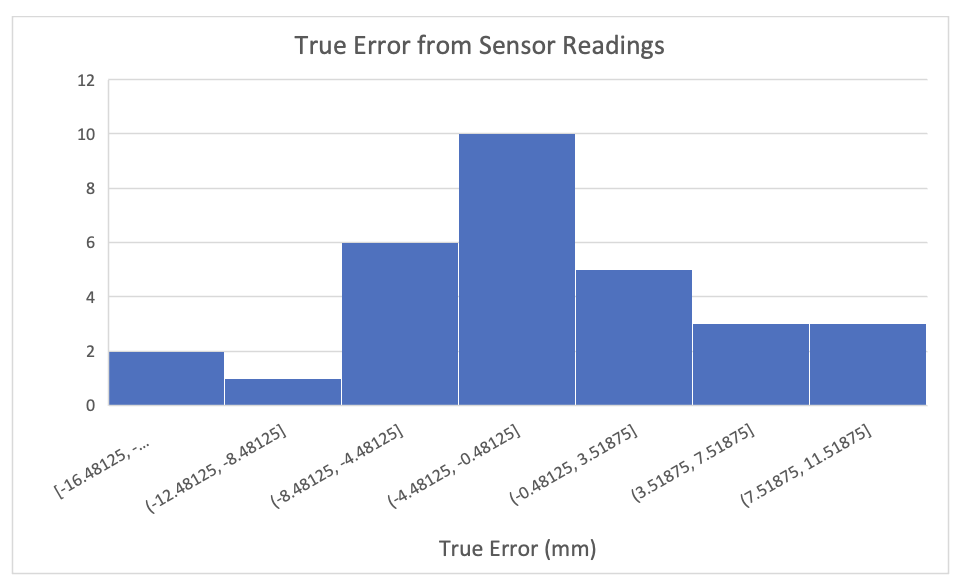
As stated previously, the average distance readings in the spreadsheet were calculated by taking sixteen different readings that the sensor was outputting through the serial monitor. Thirty distance measurements were taken at different distances from the wall, and the distance error that was produced from the expected distance versus the observed distance from the sensor was recorded for each trial. Through observation of the datasheet above, one can see that the average true error, is equal to mm – which is noticeably smaller than zero. This trend continues when observing the boxplot where the median of the true error is found to be mm. Both of these values can be considered significantly smaller than zero – indicating that the true error present in the sensor may be statistically different from zero. However, in order to find statistical evidence to support the claim, there must be various statistical tests conducted. The distribution of the collected true error data appears to be slightly skewed-left – as can be observed through the boxplot. However, when observing the histogram above, we can see that the distribution looks roughly normal. When performing a Shapiro-Wilk test for normality on the true error data, the data is shown to be approximately normal. Due to the data’s normality, the statistical tests that will be utilized below will be both a bootstrap and confidence interval to estimate the population true error, The outcome of this test will be displayed below:
Because zero is contained within both of these intervals, we can conclude that the population true error is negligible from zero. Consequently, these tests suggest that there is not enough evidence to deem the distance readings from the HC-SR04 sensor to be statistically different from the actual distances measured. While based on the data provided we can determine that the population average of true error is not statistically different from zero, there is still a possibility that true error fluctuates as the distance between the sensor and the wall grows. Due to this, a series of other statistical tests must be conducted to determine the relationship between distance and true error, if present. The results of these tests will be shown below:

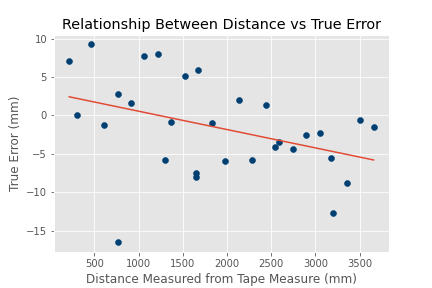
As can be observed from the scatter plot and confidence interval above, there appears to be a generally negative trend in the relationship between the two variables, indicating that as the distance between the sensor and the wall increased, the sensor began to undermeasure the distance. While this may be the case, there may be data points that are skewing the relationship seen in the regression line. In order to obtain better insight into the relationship between the two variables, there must be more statistical tests conducted. The first statistical test will be a -test of the slope of the regression line to determine if it statistically-significant from zero. The results from this test will be displayed below:
Let Sample Slope of True Error Regression and Population Slope of True Error Regression, Standard Error of the True Error Regression Slope, and
Given:
Test:
Recall and
t=−0.002388−00.001037=−2.30280
P=0.01
Because the value calculated from the true error regression slope is less than the accepted level of significance at there is considerable evidence that there may be a negative relationship present between the distance by which the sensor is measuring from the wall and the true error from 21.6 cm to 365.8 cm. However, as stated previously, there is a possibility that the presence of outliers affected the slope of the regression line. In order to further test the effect that distance has on the error, there must be a two-sample test between the fifteen longest and fifteen shortest distances to determine if there is a significant difference between the two true errors. The distribution of the true error is approximately normal; however, when split into two equal groups, the sample size, of each group will be equal to individual distance measurements. Because of this small sample size, a bootstrap interval for the difference in two population means will be conducted to confirm whether a relationship is present between measured distance and true error. The results from this can be seen below:
By observing the table above along with the provided descriptive statistics, one can see that there is a noticeable difference of means between the shorter distance measurements and the longer ones (>4 mm). The variation also surprisingly increases with the shorter measurements in comparison to the longer ones. However, that may be due to outliers present within the data. Nonetheless, a bootstrap interval between the difference of the two means must be executed to estimate where the population difference may be. The results of this bootstrap interval will be displayed below:
Because zero cannot be found in the bootstrap interval, there is a significant amount of evidence that a relationship between the variability of the true error measurements and the distance measured from the wall exists. This may indicate that there actually is an underestimation in distance measured from the sensor as the length measured increases within the scope of the measurements used in this study. From here, the claim that the maximum absolute error in the HC-SR04 sensor is equal to 3 mm will now be tested. A data spreadsheet of the sensor readings along with its descriptive statistics will be shown below:
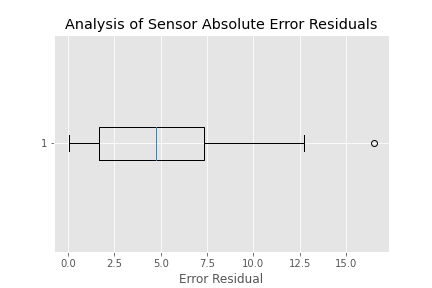
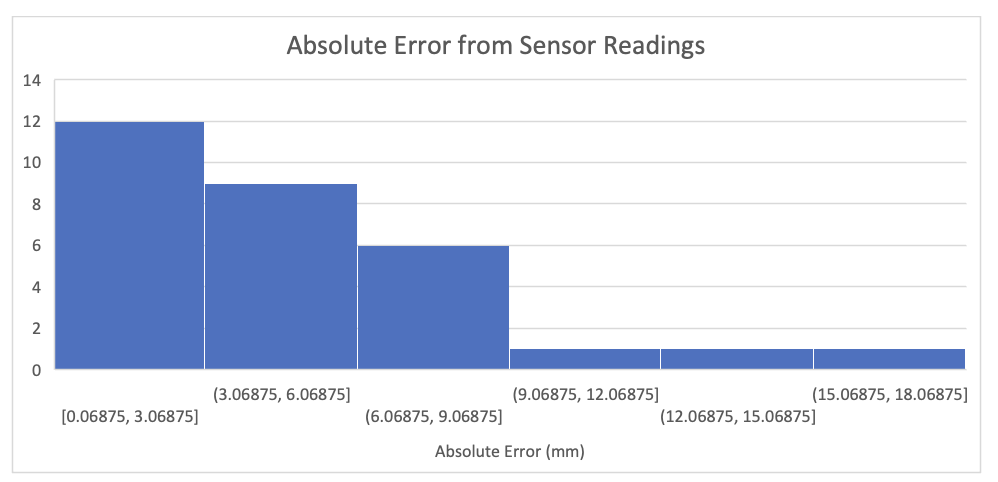
At first observations of this datasheet, the average absolute error, looks significantly larger than the manufacturer’s claimed error of ~3 mm. In fact, the percent error between the two is approximately over 66%! However, when analyzing the dataset further, we can observe a boxplot and histogram that will describe the distribution of the data further:


By observing this boxplot and histogram, we can see that the distribution of the plot looks approximately skewed-right with a median equaling 4.74375 mm. With closer analysis of this data’s distribution, one can discover that the distribution of this data resembles a folded normal distribution. A folded normal distribution is a generalization of the half-normal distribution where its random variable can be represented as due to its distribution essentially being the absolute value of a normal distribution (Glen, 2015). This distribution shape arises specifically in data that is not concerned with its direction but only its magnitude, and because our distribution contains the absolute value of the error readings, the distribution of the histogram above is more than likely a folded normal distribution (Glen, 2015). With the median being still being significantly far away from the expected error value of ~3 mm, there is a strong possibility that the average error, was not affected by the presence of outliers, and that the average error may actually be significantly larger than the claimed error average. Nonetheless, in order to determine if the collected error dataset is statistically different from the manufacturer’s claimed error, both a bootstrap and confidence interval for the population absolute error average must be utilized. This test’s results will be displayed below:
Because the claimed population error mean (3 mm) cannot be found within either the bootstrap interval nor the confidence interval, there is not enough evidence that the sample error mean and the manufacturer’s claimed error mean are equivalent. This means that the difference between the two means is statistically large enough to be deemed significant – which may provide evidence that the population absolute error mean claimed by the manufacturers could be incorrect. In fact, according to this data, the absolute error present in distance readings may be greater than 3 mm for all sensors. To further explore this error, a study of the absolute relative error will now be conducted to statistically determine how far away the sensor’s error is from its expected value, 3 mm. The results from this study will now be displayed:
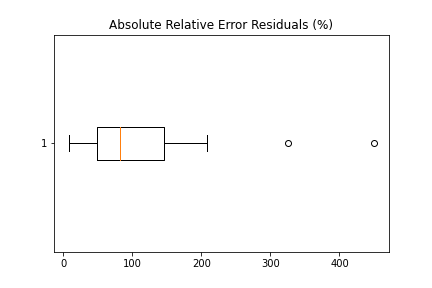
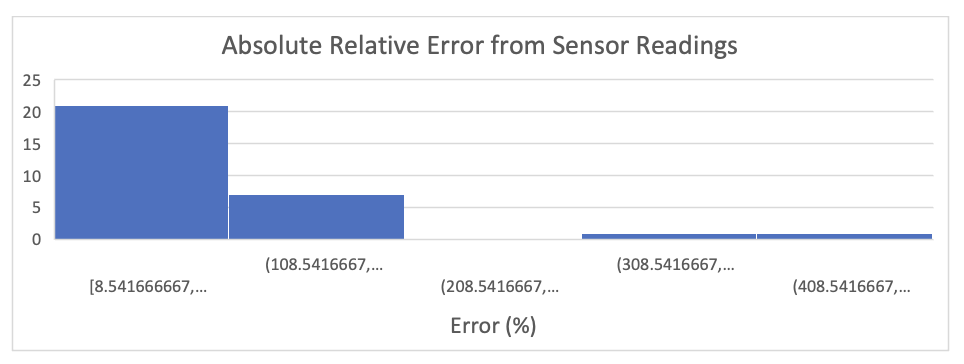
Through initial observations, one can see that the average relative error is over 106% with a substantial amount of variation present between the distance readings. Based on these numbers, it begins to become clear that the absolute error collected from the study and the error collected by several manufacturing websites are significantly different. By observing both a boxplot and histogram of this data, we can take a deeper look into its distribution and estimate how far away the population absolute relative error is away from zero. The boxplot and histogram derived from this data will be displayed below:
.png)

By analyzing both the boxplot and histogram, we can see that the absolute relative error has a skewed-right distribution – much like the absolute error distribution from previously. Much like the absolute error that was analyzed previously, the distribution observed from this histogram seems to be a folded normal distribution in shape. We can also easily see that the minimum value in both the boxplot and histogram is 8.5417%. Because of this, the likelihood that our sensor’s absolute relative error average is equivalent to zero percent is highly unlikely. However, there still must be more statistical tests conducted to prove that, without uncertainty, the population absolute relative error average is statistically different from zero. The results from these tests can be seen below:
Because zero percent clearly cannot be found within either interval, we can conclude that there is significant evidence that the population absolute error average is much different from what is being shown in several datasheets. Much like the previous study on absolute error, these statistics show that the error is significantly larger than what was expected from the manufacturing sheets.
Conclusion
Through this experiment, the HC-SR04 ultrasonic sensor manufacturer’s claimed distance error was proved to possibly be invalid and there may be an additional form of error present as the distance between the sensor and an object become farther from each other. A possible source of error that was present in this experiment included human error when measuring the distance from the wall to the sensor using a tape measure. While the robot and the tape measure were aligned as close as possible on every trial, it is possible that they were slightly-misaligned on certain trials – introducing more error to each trial. Throughout the duration of collecting sensor data, there was only one sensor that was used to collect all of the distance readings. While unlikely, it is possible that the sensor used in this experiment was faulty and produced inaccurate results because of it. Another factor that may have produced inaccurate results from the statistical tests could be looked at from the fact that the sample size of the data used was only 30 samples. For future works, there should be a more accurate way of determining the actual distance between the sensor and an object – instead of a tape measure. There should also be a more-precise way of aligning the robot when taking distance readings so that there would not be any additional error in that regard. Multiple HC-SR04 ultrasonic sensors should be used when taking distance readings so that any additional error present in one sensor can be compensated for by other sensor readings. Most importantly, there should be a larger sample taken in order to obtain more accurate parameters to estimate the population error for the HC-SR04 ultrasonic sensor.
The tape measure’s measuring units are only in inches; however, the error given in manufacture datasheets was given in units of millimeters. To counter this, dimensional analysis was utilized to convert the measurements from the tape measure from inches into millimeters.